Exam Objectives
Quick Overview of Training Materials
Exam Ref 70-486: Developing ASP.NET MVC 4 Web Applications - Objective 4.1
Programming ASP.NET MVC 4 (OReilly) - Chapter 16 (Logging, tracing)
Professional ASP.NET MVC 5 (WROX) - Chapter 17 (ELMAH, Profiling)
Debugging, Tracing and Instrumentation in .NET and ASP.NET
MSDN - Debugging, Tracing, and Profiling
MSDN - Code Contracts
MSDN - ASP.NET Health Monitoring Overview
MSDN - MVC Music Store Application logging feature
MSDN - ASP.NET Performance Monitoring, and When to Alert Administrators
MSDN - Beginners Guild to Performance Profiling
MSDN - Tracing and Instrumenting Applications
MSDN - Using IntelliTrace
Code Contracts in C#
My post on Debug an Azure Application overlaps with this one somewhat.
My demo code for this objective on Github.
So I want to start out by saying that the Exam Ref, for once, is actually a pretty useful reference for this objective. I spend a lot of time bagging on it (most of the time it's probably deserved), so I thought it only fair that I point out when it gets something right...
Troubleshoot performance, security, and errors
Visual Studio includes analysis and profiling tools that can give you a great deal of telemetry data on your application. Credit goes to the Exam Ref for pointing me to the Performance Wizard and Profiler. Under the ANALYZE top level menu, select "Performance and Diagnostics" to start the Performance Wizard.

Each of the four options monitors a specific metric, and so give you very different information about your application. To try them out, I added a few methods to the Home controller in the standard MVC template (code on Github):
- Slow() : Download "espn.go.com" three times, then return a string. Example of a slow method that is not necessarily CPU intensive. Tried to just "Thread.Sleep" this at first, but that didn't work...
- HighCPU(): Make 1M calls to "Console.Write(xxx)". Single thread tearing up the processor usage.
- ThreadContention(): Make 1M calls to "Console.WriteLine" in parallel. Creates some artificial thread contention as they sometimes fight over the Console.
- MemorySink(): Uses a linked list and string concatenation to ramp up the memory usage. This one was tricky: Just concatenating one giant string didn't really work, since it would throw an OutOfMemory exception around 40Mb (because there wasn't one continuous block that size available). By using somewhat smaller strings stored in a linked list (no underlying array), I could use fragmented system memory more effectively and was able to throw about 450Mb in before it bombed out (though actual memory may have been even higher!)
CPU Sampling
This method takes readings on the CPU usage and monitors which function calls are hammering the CPU. The summary screen includes a graph of the CPU usage over time, and several subreports include specific data on which parts of the application are causing the most usage.


Unsurprisingly, the functions writing to console output a million times each are the ones using the most CPU cycles. ThreadContention is the worst, and appears in the "Hot Path" in the summary. In the Functions section of the summary, it lists Console Write and WriteLine as doing most of the work; while this is true (they're being called a million times each), it doesn't really get at the root cause. Fortunately the subreports give us a bit better "big picture" of whats happening, pointing to the real culprits.
Instrumentation
This method profiles how long the application is spending in a given function. This differs from the CPU usage example in that it is looking at elapsed time. A slow method may not be slow because it is chewing up the CPU and thus would raise any flags in the CPU sampling profile. One of my dummy methods makes multiple calls with the HTTP client class, waiting synchronously for a reply from an external web server. Like CPU sampling, the summary page includes a chart with CPU usage history, but the metrics are all based on time%:


Here the "Hot Path" clearly shows that the function tying up the application for the most time is the "Slow()" method, waiting for espn.go.com to load repeatedly. The CPU intensive functions also take up a lot of time too.
.NET Memory Allocation
I learned more about the way memory management works in .NET and Windows in general just trying to exercise this profiling method (StackOverflow reference):
- The stack is tiny, and it only takes a few megabytes of data to blow the stack. So I wasn't going to get anywhere with the stack (so the 10,000 deep recursive method calls were a bust).
- I figured I was getting somewhere when I started throwing OutOfMemory exceptions instead of StackOverflowExceptions, but the string I was appending was only 40 or 50 Mb when it broke, so I knew something unexpected was happening. The reason is that a string needs a continuous block of memory. So it wasn't that I was actually out of physical memory, it just didn't have a single big block.
- Despite being 64bit Windows, when I tried to target x64 it wouldn't compile. I probably have some 32bit parts attached (library, package, something) but I wasn't going to spend a lot of time chasing it down. In 32bit address space, 4Gb of memory can be addressed. Windows limits a single process to 2Gb, and .NET has a pretty sizable overhead, so from what I could gather, you are typically bound to about 800-1000 Mb anyway, which is consistent with what I was able to push in this test.

What I also found interesting is that creating a memory black hole didn't require melting down the CPU in the process. MemorySink() creates a 40Mb string with one for loop, then copies that string into a list a few hundred times. It's the second fastest function of the lot (other than MemoryRelease() which does almost nothing), yet we see above that it uses a huge chunk of memory compared to the CPU burning methods.
Resource Contention Data


Running Profiling
Once a profile method has been configured with the Performance Wizard, it will appear in the Performance Explorer. These profiles can then be reconfigured to a certain extent and rerun as changes are made to the application. Each run of the profile creates a new report.

While I may be mistaken, it seems the author of the exam ref is under the impression that there is a difference between the "Profiler" in Visual Studio and the Performance Wizard. Really all that is happening is that the Performance Wizard creates a profiling session, and the profiler runs those sessions. Two sides of the same coin.
Manually Instrumented Tracing
Tracing in .NET is based on an events model. Trace events are fired within our code, and then logged by various trace listeners. We can define a trace source that uses a source switch to control which events are written to the listeners attached to that source. Listeners exist that will write to a number of different sources (poached these from the MSDN article):
- A TextWriterTraceListener redirects output to an instance of the TextWriter class or to a Stream.
- An EventLogTraceListener redirects output to an event log.
- A DefaultTraceListener emits Write and WriteLine messages to the OutputDebugString and to the Debugger.Log method. In Visual Studio, this causes the debugging messages to appear in the Output window.
- A ConsoleTraceListener directs output to either standard output or standard error.
- A DelimitedListTraceListener directs output to a text writer in a delimited text format that uses the delimiter specified.
- An XmlWriterTraceListener directs output as XML-encoded data to a TextWriter or to a Stream.
One way to accomplish tracing in an application is to make calls to methods on the Trace and Debug classes at important milestones in our code. These two classes are identical with one exception: Trace is compiled into Release builds while Debug is not (by default). With no configuration at all, output goes to the output -> debug window in Visual Studio:

While this can be helpful in local development, it doesn't really help diagnose problems in production. It is, however, easy enough to write trace output to a file with a bit of configuration in the web.config file (under system.diagnostics):
    <trace autoflush="true">
      <listeners>
        <clear />
        <add name="textwriterListener"
             type="System.Diagnostics.TextWriterTraceListener"
             initializeData="c:\Trace\outfile.txt" />
      </listeners>
    </trace>
Don't forget to enable tracing in the application:
  <system.web>
    <trace enabled="true"
           requestLimit="10"
           localOnly="false"
           writeToDiagnosticsTrace="true"
           pageOutput="false" />
    ...
  </system.web>
So a call to the same method will result in the following output:

It is easy to attach additional information to the trace messages, such as ProcessId and DateTime, by adding the traceOutputOptions attribute to the <add> element under listeners:

Windows Event Log
Another mechanism for logging is the Windows eventlog. Calling EventLog.WriteEntry() will create a log entry, though there is at least one caveat. Writing to the eventlog requires providing a known source. For the purposes of demonstration I created a source called "MYEVENTSOURCE" using a command prompt with admin privileges:

Without this known source, calling EventLog will likely result in a security exception as either IIS or the framework will try to create a source on the fly, but IIS doesn't have read access to the eventlog security logs. I monkeyed around with this for a couple hours trying to get it to work, and had no success until I found the command line version. It is also possible to create a source programatically by calling EventLog.CreateEventSource(), assuming the permissions were granted correctly (Stack Overflow). Once the source is created, we use it like so:
EventLog.WriteEntry("MYEVENTSOURCE",
    "Create log in Windows Event Log!",
    EventLogEntryType.Warning, 9999);

Using Event Source
One way to have finer grain control over what gets written to a certain log file is to use a custom event source with switches (as described in the Code Project article on tracing). One thing the Code Project example does that is kind of confusing is present a definition for a source without also including a switch. Later in the article they talk about using a switch but presenting them separately was confusing and caused me a lot of grief trying to figure out why my listeners on my source weren't writing. Just for fun I tried some of the other listener types, and after figuring out that any misconfiguration in ANY tracing element will cause all of them to silently stop working (I had an empty string set for the traceOutputOptions in the <trace> element... oops). This was what I came up with:
Web.config (still under system.diagnostics)
    <sources>
      <source name="MySource" switchName="mySwitch" switchType="System.Diagnostics.SourceSwitch">
        <listeners>
          <clear/>
          <add name="textwriterListener"
               type="System.Diagnostics.TextWriterTraceListener"
               initializeData="c:\Trace\MYEVENTSOURCE.txt"
               traceOutputOptions="ProcessId, DateTime"/>
          <add name="delimitedListener"
               type="System.Diagnostics.DelimitedListTraceListener"
               delimiter=","
               initializeData="c:\Trace\MYEVENTSOURCE.csv"
               traceOutputOptions="ProcessId, DateTime"
               />
          <add name="consoleListener"
               type="System.Diagnostics.ConsoleTraceListener"
               traceOutputOptions="ProcessId, DateTime"/>
          <add name="xmlListener"
               type="System.Diagnostics.XmlWriterTraceListener"
               initializeData="c:\Trace\MYEVENTSOURCE.xml"
               traceOutputOptions="ProcessId, DateTime"/>
        </listeners>
      </source>
    </sources>
    <switches>
      <add name="mySwitch" value="Information"/>
    </switches>
HomeController.cs
public string TryEventSource()
{
    FileStream ostrm;
    StreamWriter writer;
    TextWriter oldOut = Console.Out;
    ostrm = new FileStream("c:\\Trace\\Console.txt", FileMode.OpenOrCreate, FileAccess.Write);
    writer = new StreamWriter(ostrm);
    Console.SetOut(writer);

    TraceSource trace = new TraceSource("MySource");
    trace.TraceEvent(TraceEventType.Error, 0, "crap crap crap crap crap crap");
    trace.TraceInformation("This is a call to trace.TraceInformation...");
    trace.Close();
    Console.SetOut(oldOut);
    writer.Close();
    ostrm.Close();

    return "Output file should have some crap in it...";
}
The result was four text files with the expected output.
Logging with Attributes
The MVC Music Store demo app includes a exercise on using attributes for logging, which I used as a basis for some quick screwing around. I didn't feel like dealing with all the EF infrastructure to make logging to a database work, so I changed it to work with a text file in my tracing folder called "AttributeLog.log". The code is pretty straight forward, just create an action filter that inherits from ActionFilterAttribute and implements the IActionFilter interface, then override OnActionExecuting:
public class ActionLogFilterAttribute : ActionFilterAttribute, IActionFilter
   {
       public override void OnActionExecuting(ActionExecutingContext filterContext)
       {
           using(var log = new StreamWriter(
               new FileStream(@"c:\Trace\AttributeLog.log", FileMode.Append)))
           {
               var Controller = filterContext.ActionDescriptor.ControllerDescriptor
                   .ControllerName.PadRight(16).Substring(0,16);
               var Action = filterContext.ActionDescriptor.ActionName
                   .PadRight(24).Substring(0, 24);
               var IP = filterContext.HttpContext.Request.UserHostAddress
                   .PadRight(16).Substring(0, 16);
               var DateTime = filterContext.HttpContext.Timestamp;
               var Principle = "";
               try
               {
                   Principle = filterContext.HttpContext.User.Identity.Name
                       .PadRight(24).Substring(0, 24);
               }
               catch
               { }

               if (Principle.Equals(""))
                   Principle = "Anonymous".PadRight(24).Substring(0, 24);

               log.WriteLine(DateTime + " || " +
                             IP + " || " +
                             Controller + " || " +
                             Action  + " || " +
                             Principle);
           }

           base.OnActionExecuting(filterContext);
       }
   }
Now it's just a matter of decorating any controller or action method you want logged with the [ActionLogFilter] attribute, and voila, activity logs:

Using IntelliTrace©
IntelliTrace is a historical debugging tool included in Visual Studio Enterprise (Ultimate before 2015). IntelliTrace collects debugging events, exceptions, .NET framework events, and other system events (such as SharePoint) and saves them to an .iTrace file that can be replayed later in Visual Studio. IntelliTrace events can be configured in Visual Studio under TOOLS -> Options -> IntelliTrace:

The General options will allow to to switch between just collecting IntelliTrace events and collecting events and method call information. Collecting the call information can have a negative affect on performance. The Advanced setting lets you enable automatically recording the IntelliTrace data to a file and setting the max amount of space to be used.
The walk through on MSDN has us enable File events and then play with their app. Since my demo already has the attribute logging writing to a file, this should generate a good bit of IntelliTrace data. To view the IntelliTrace data in VS, you have to hit a break point. This is what mine looked like after a few API calls (VS 2013 Ultimate, the screenshots from 2015 Enterprise look different, but the same general idea):

The repeated accesses to the AttributeLog.log file are shown, as well as the write to outfile.txt by the trace writer. We can also see an Exception (OutOfMemory thrown and caught by the MemorySink() method) and the ASP.NET events triggered by the Ajax calls to the Home Controller. Clicking the file icon will allow you to save the trace data to a file, which you can then reopen in Visual Studio:

Enforcing code contracts
Code contracts provide a mechanism for ensuring that code is always in a valid state. This is accomplished through several mechanisms (lifted from MSDN article):
- Preconditions, specified with Contract.Require(), specify state when a method is invoked.
- Postconditions, specified with Contract.Ensure(), specify state when a method is terminated.
- Invariants, specified with Contract.Invariant(), specify the state a class should be in when it is publicly visible to a client. It is checked at the end of each public method.
In order to use code contracts in Visual Studio, you have to install the Code Contracts for .NET extension. Wasted a good half an hour trying to figure out why nothing worked and why I didn't see the configuration options until I looked at the exam ref again. *facepalm*. Once the extension is installed (you'll have to restart VS), you can right click on the project and select properties and the Code Contract options will be at the bottom:

You'll need to include #define CONTRACTS_FULL to enable code contracts (much of the Contract class is conditionally compiled). While it's pretty simple to include Require and Ensure calls directly in a method (much as you might use the Assert class), a much more interesting application of contracts is applying them to interfaces. This separates the contract from the implementing code. The example on the MSDN article uses an IArray as an example, I made mine a bit simpler:
      string _x = "";
    public string CodeContract(string x)
    {
        IContract contract = new ContractImpl();


        //static checking will throw a build warning
        //contract.CodeContract(null);

        try
        {
            this._x = x;
            return contract.CodeContract(x);
        }
        catch (Exception ex)
        {
            return ex.Message;
        }
    }

    [ContractInvariantMethod]
    private void ObjectInvariant()
    {
        //sending "poof" will throw an uncaught exception
        Contract.Invariant(!this._x.Equals("poof"));
    }
}

[ContractClassFor(typeof(IContract))]
internal abstract class CodeContract : IContract
{
    string IContract.CodeContract(string x)
    {
        Contract.Requires(x != null, @"Can't be null");
        Contract.Requires(!x.Equals("Yaarg!"), "We hate pirates!");
        int result = 0;
        Int32.TryParse(x, out result);
        Contract.Ensures(result == 0 || result > 100,
            "If you pass a number, must be greater than 100, fool!");
        return default(string);
    }
}

[ContractClass(typeof(CodeContract))]
public interface IContract
{
    string CodeContract(string x);
}

public class ContractImpl : IContract
{
    public string CodeContract(string x)
    {
        return "Apparently " + x + " is ok...";
    }
}
The top CodeContract method and the invariant method both live in the HomeController class. That CodeContract call just defers to the ContractImpl class, which implements IContract. Notice nowhere yet has any Contract method been directly invoked. The IContract interface, however, has a contract class defined for it. IContract and the CodeContract class are linked by the [ContractClass] and [ContractClassFor] attributes.
The invariant method ObjectInvariant() is called when any public method is terminated. If "poof" is passed as an argument, the assignment to _x will succeed, but the invariant will throw an exception when the method terminates. Since I haven't set up any exception handling, this will cause a 500 response to the browser.
Code contracts include both runtime and static checking. Compile time contract violations are reported as warning:

Enable and configure health monitoring
Health Monitoring is a tool to monitor and report on various events generated by the .NET framework while the web application is running. I had a pretty difficult time getting it to work initially... either the site styling was totally whack, or it would throw a strange error complaining about not being able to find "System.Web". Once I set "System.Web" to copy locally, I was able to make some progress and eventually get it working:

When you have the secret sauce and can get it working, Health Monitoring is configured in web.config, in the system.web element. The example I found on MSDN for using a Trace provider to transmit health monitoring events as traces was a bit flawed, however I was able to massage it a bit to get it working:
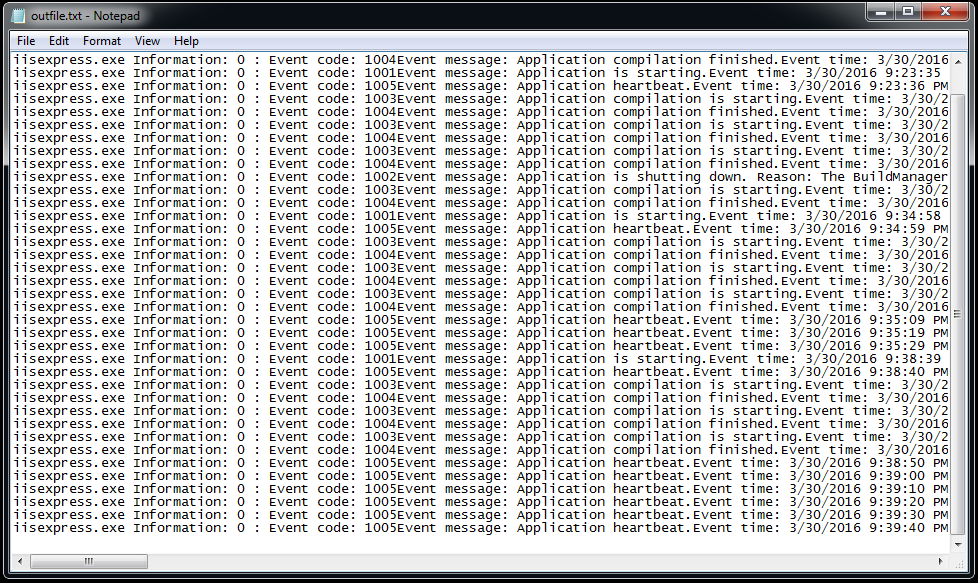
   <healthMonitoring
      enabled="true"
      heartbeatInterval="10">
      <eventMappings>
        <add name="Web App Lifetime"
             type="System.Web.Management.WebApplicationLifetimeEvent,System.Web"/>
      </eventMappings>
      <providers>
        <add name="TraceEventProvider"
            type="System.Web.Management.TraceWebEventProvider,System.Web"/>
      </providers>
      <profiles>
        <add name="Trace"
            minInstances="1"
            maxLimit="Infinite"
            minInterval="00:00:00"
        />
      </profiles>
      <rules>
        <add name="Trace Request Processing"
            eventName="Request Processing Events"
            provider="TraceEventProvider"
            profile="Trace"
        />
        <add name="Heartbeat Events"
            eventName="Heartbeats"
            provider="TraceEventProvider"
            profile="Trace"
        />
        <add name="Application Lifetime"
             eventName="Web App Lifetime"
             provider="TraceEventProvider"
             profile="Trace"
        />
      </rules>
    </healthMonitoring>
There was some pretty obvious activity in the outfile.txt file there the traces are recorded, which looked to be life cycle and heartbeat events. The events were pretty verbose, so it wouldn't be too hard to create some unwieldy logs if you weren't careful. I've set the heartbeat to 10 seconds which is totally excessive for production use, but it generated a few events pretty quickly for demonstration purposes:
The main pieces of Health Monitoring are the events and providers. The event classes all derive from WebBaseEvent (descriptions from MSDN documentation). Here are the most relevant (omitting most of the base classes and overly specific subclasses):
- WebHeartbeatEvent - The heartbeat health-monitoring events serve as a timer for the ASP.NET health-monitoring system.
- WebRequestEvent - Raised with every web request
- WebApplicationLifetimeEvent - Application lifetime events include events such as application startup and shutdown events.
- WebErrorEvent - Provides information about errors caused by problems with configuration or application code.
- WebAuditEvent - The audit events generate information about security-related operations in a Web application and provide both a success and failure event for each audited operation.
- EventLogWebEventProvider - logs ASP.NET health-monitoring events into the Windows Application Event Log.
- WmiWebEventProvider - maps ASP.NET health-monitoring events to Windows Management Instrumentation (WMI) events.
- SqlWebEventProvider - saves event notifications to an SQL database.
- SimpleMailWebEventProvider - sends e-mail for event notifications.
- TemplatedMailWebEventProvider - uses templates to define and format e-mails it sends for event notifications.
- TraceWebEventProvider - sends ASP.NET health-monitoring events as trace messages.
I noticed with my file based trace logs, events would sometimes be slow to be added to the log. The latency wasn't terribly onerous, and could just be a function of too many players trying to write to the same file and having to take turns, who knows...
The Exam Ref lumps Performance Monitor in with the first subsection on troubleshooting, but the exam objective kind of throws it in with Health Monitoring, go figure. Performance Monitor (perfmon), at first glance, just looks like a less polished version of Task Manager. Where Performance Monitor differs, however, is that there are hundreds of performance counters you can enable to track pretty much any aspect of the machine. This could be very useful to run on a server hosting an ASP.NET application:

Although probably not strictly necessary for purposes of studying for the certification test, I think it's worth noting a couple of third party tools that might make diagnosing errors and debugging applications easier. Both of these tools were suggested in the Professional ASP.NET MVC 5 book.
The first is Glimpse. This is a free, open source Nuget package which adds a small heads up display to the page giving instant feedback on responsiveness. It's stupid easy to install (you really just install the Nuget package). The image below shows the Glimpse HUD along the bottom of the page, with the Ajax request section expanded:

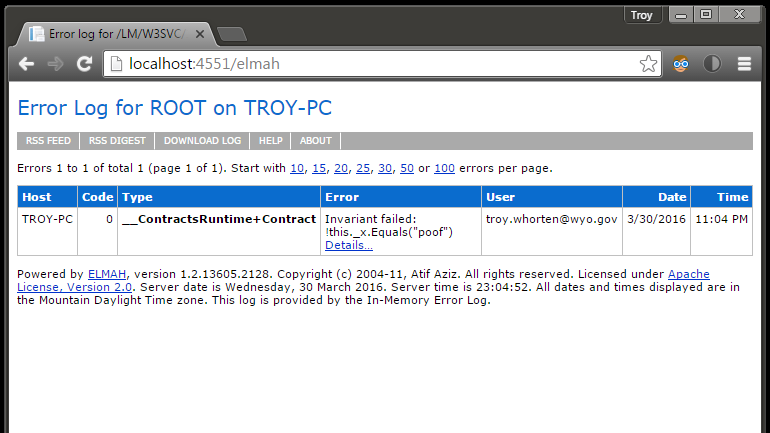
The second tool is ELMAH, or Error Logging Module and Handler. Elmah adds an additional layer of error handling to the application. All unhandled errors are logged, and these logs are easily accessible though the web interface. One gotcha which this, though, is that the elmah logs should really be secured. A lot of valuable security information can be gleaned from elmah logs and it isn't hard to find unsecured elmah pages with a quick Google search. According to the book, elmah is only accessible from localhost by default. Care should be taken when granting remote access to elmah.axd to ensure that only authorized users are granted access.
I generated a uncaught exception by running "poof" through the contract testing code. The elmah.MVC package maps the /elmah route to the error log:
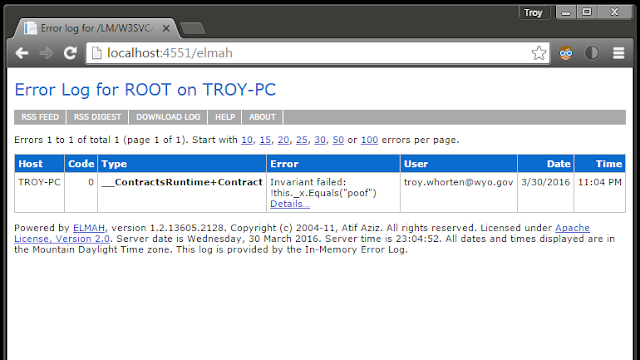
By default, elmah writes logs to an in-memory database, which isn't terribly useful for a production website, however there are additional elmah packages that allow it to write to a database. The example in the book also includes code to write to Azure Table storage.
Performance Monitor
The Exam Ref lumps Performance Monitor in with the first subsection on troubleshooting, but the exam objective kind of throws it in with Health Monitoring, go figure. Performance Monitor (perfmon), at first glance, just looks like a less polished version of Task Manager. Where Performance Monitor differs, however, is that there are hundreds of performance counters you can enable to track pretty much any aspect of the machine. This could be very useful to run on a server hosting an ASP.NET application:

Third Party Tools
Although probably not strictly necessary for purposes of studying for the certification test, I think it's worth noting a couple of third party tools that might make diagnosing errors and debugging applications easier. Both of these tools were suggested in the Professional ASP.NET MVC 5 book.
The first is Glimpse. This is a free, open source Nuget package which adds a small heads up display to the page giving instant feedback on responsiveness. It's stupid easy to install (you really just install the Nuget package). The image below shows the Glimpse HUD along the bottom of the page, with the Ajax request section expanded:

The second tool is ELMAH, or Error Logging Module and Handler. Elmah adds an additional layer of error handling to the application. All unhandled errors are logged, and these logs are easily accessible though the web interface. One gotcha which this, though, is that the elmah logs should really be secured. A lot of valuable security information can be gleaned from elmah logs and it isn't hard to find unsecured elmah pages with a quick Google search. According to the book, elmah is only accessible from localhost by default. Care should be taken when granting remote access to elmah.axd to ensure that only authorized users are granted access.
I generated a uncaught exception by running "poof" through the contract testing code. The elmah.MVC package maps the /elmah route to the error log:
By default, elmah writes logs to an in-memory database, which isn't terribly useful for a production website, however there are additional elmah packages that allow it to write to a database. The example in the book also includes code to write to Azure Table storage.
The system.web/trace[enabled] switch enables or disables tracing of the ASP.NET pipeline during page request, not the text written using Debug/Trace.WriteLine ect.
ReplyDeleteText from Trace/Debug classes is written when DEBUG/TRACE constants are defined (in most cases set on project build properties) and there are some listeners .
Basically the system.web/trace is for traces you see in the Trace.axd, the DEBUG/TRACE is for system.diagnostics , but TRACE does not enable/disable stuff written using TraceSource. TraceSource is configured using switches.
See https://channel9.msdn.com/Blogs/ASP-NET-Site-Videos/how-do-i-implement-tracing-in-an-aspnet-web-site
It wasn't very clear from the text. Thanks a lot for this great study guide.
Thanks for the thoughtful reply Honza! I remember this being a really huge topic (probably worthy of more than one blog post, honestly, ha!). I probably got a bit turned around at times, I appreciate you providing the clarification =)
DeleteI found this article easy to understand and very helpful. Can’t wait to see the other posts. Thank you for sharing!
ReplyDeleteMelbourne Web Developer